


What This Does #
Shows you how your bot is performing, what users are asking, and where you can improve.
When to Use This #
- You want to understand how well your bot is working
- You need to identify common user problems
- You’re looking for ways to improve bot performance
- You want to measure business impact
Step-by-Step Instructions #
- Access Analytics
- Navigate to Analyze tab
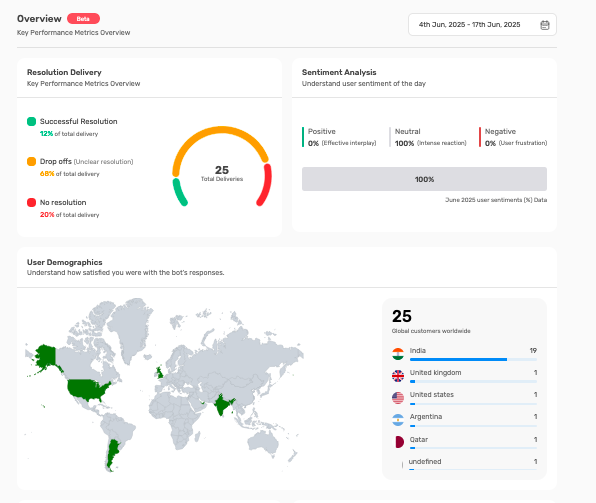
- You’ll see the main overview dashboard
- Use date picker to select time period for analysis
- Review Key Metrics
- Resolution Delivery: See how well your bot solves problems
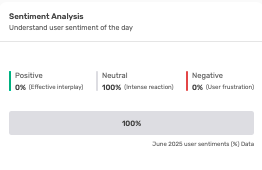
- Sentiment Analysis: Understand user emotions and satisfaction
- User Demographics: Learn about your audience
- Analyze Performance Data
- Look for trends and patterns
- Compare different time periods
- Identify areas needing improvement
Understanding Key Metrics #
Resolution Delivery Breakdown:
Successful Resolution (Green):
- What it means: Bot completely solved the user’s problem
- Target goal: Aim for 70%+ success rate
- Good performance: Shows bot knowledge is comprehensive
- Low numbers: Indicates need for more training content
Drop-offs (Orange):
- What it means: Users left without getting help
- Concerning if high: May indicate poor user experience
- Common causes: Slow responses, unhelpful answers, confusing interface
- Action needed: Review conversation flows and bot responses
No Resolution (Red):
- What it means: Bot couldn’t help, needed human intervention
- Some percentage normal: Complex issues always need human help
- High numbers concerning: May indicate missing knowledge areas
- Action needed: Add more content, improve bot training
Sentiment Analysis Insights #
Positive Sentiment:
- Indicators: Thank you messages, satisfaction expressions, positive feedback
- High positive: Shows users are happy with bot experience
- Business value: Correlates with customer satisfaction and loyalty
- Maintenance: Keep doing what’s working well
Neutral Sentiment:
- Indicators: Factual questions, straightforward information requests
- Normal baseline: Most business interactions are neutral
- Professional interactions: Shows bot maintains appropriate tone
- Optimization: Look for opportunities to create more positive experiences
Negative Sentiment:
- Indicators: Frustration, complaints, expressions of dissatisfaction
- Immediate attention: High negative sentiment needs quick action
- Common causes: Incorrect answers, poor understanding, technical issues
- Action required: Review and improve problematic conversation areas
User Demographics Analysis #
Geographic Distribution:
- World map view: Shows where your users are located
- Market insights: Understand global reach and expansion opportunities
- Localization needs: Identify markets requiring language support
- Business planning: Inform international expansion decisions
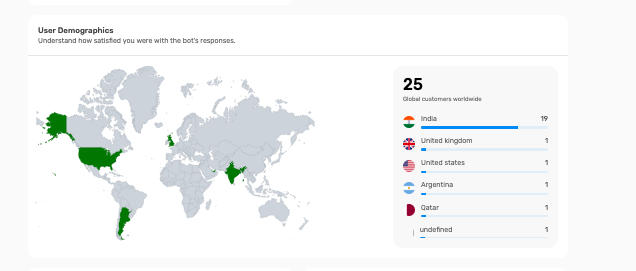
Global Customer Count:
- Total users: Overall reach of your bot
- Growth tracking: Monitor increasing user base over time
- Market penetration: Understand adoption in different regions
- Scaling decisions: Plan resources based on user growth
Date Range Analysis #
Choosing Time Periods:
- Daily view: Monitor recent performance and quick changes
- Weekly view: See patterns and trends over time
- Monthly view: Understand long-term performance trends
- Custom ranges: Compare specific periods or events
Comparison Strategies:
- Before/after: Compare performance before and after changes
- Seasonal trends: Understand how performance varies by season
- Campaign impact: Measure effects of marketing campaigns
- Improvement tracking: Monitor progress over time
Reading Performance Trends #
Positive Trends to Look For:
- Increasing successful resolution rates
- Growing positive sentiment percentages
- Expanding user base and engagement
- Decreasing escalation to human support
Warning Signs to Address:
- Declining resolution rates
- Increasing negative sentiment
- High drop-off rates
- Concentrated problems in specific areas
Using Analytics for Decision Making #
Content Improvements:
- Low resolution areas: Add more training content
- Common questions: Create specific Q&A pairs
- Knowledge gaps: Identify missing information areas
- Content updates: Keep information current and accurate
User Experience Optimization:
- High drop-offs: Improve conversation flow
- Negative sentiment: Address frustration points
- Slow responses: Optimize bot performance
- Confusion points: Clarify bot responses and guidance
Business Strategy:
- Geographic expansion: Target high-usage regions
- Resource allocation: Focus on high-impact improvements
- Team training: Address common escalation issues
- Product development: Inform product decisions with user insights
Setting Up Regular Reviews #
Daily Monitoring:
- Quick check of key metrics
- Identify any immediate issues
- Monitor sentiment for problems
- Review recent user feedback
Weekly Analysis:
- Comprehensive metric review
- Trend identification
- Performance comparison
- Action item planning
Monthly Deep Dive:
- Strategic performance review
- Long-term trend analysis
- ROI and business impact assessment
- Planning for improvements and optimizations
Tips for Effective Analytics Use #
- Set up regular review schedule
- Focus on trends rather than single data points
- Compare performance across different time periods
- Use insights to drive specific improvement actions
- Share relevant metrics with team members
- Track impact of changes through analytics